Applies To:
KnowledgeSmart Principal Administrators and Results Administrators.
Common Causes/Issues:
You would like to understand more about the information presented on the 'Home' pages of your KnowledgeSmart admin dashboard.
Solution Overview:
When you login to your KnowledgeSmart account you will automatically be taken to the 'Home' page. This article explains more about the 'Home' pages for Tests, Surveys and Skills.
Tests / Skills assessments
This is a typical Home page view.
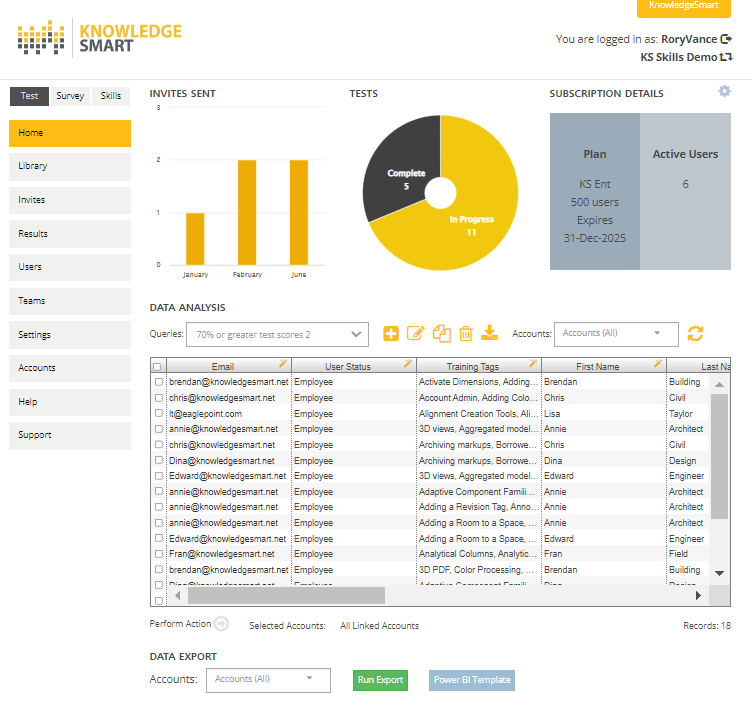
Logging out and switching accounts
Here you are shown logged in with your KS username. The icon on the right of your username is for logging out. The account name is the one which you are currently viewing. The icon to the right of
the account name will allow you to switch accounts (if you have more than one).
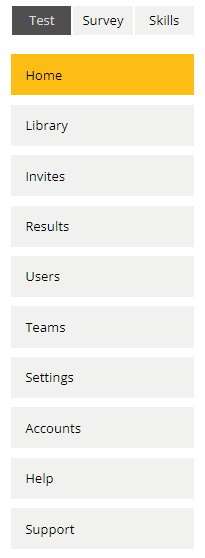
Mode and menu options
The top line buttons are for switching mode of operation. The default is 'Test'. Click on the other buttons to switch mode. All KnowledgeSmart customers can view 'Test', 'Survey' and 'Skills' mode.
The main functions of KnowledgeSmart are accessed by using the vertical menu buttons. The live function is indicated by the button being orange.
Subscription and account activity
The current subscription plan for your organization is shown in the darker gray box on the right, titled 'Plan'. The light gray box shows the current number of ‘Active’ users in a specific time frame, which has a default of 90 days. An ‘Active’ user is someone who has completed one or more Skills assessments, Surveys or Skills audits.
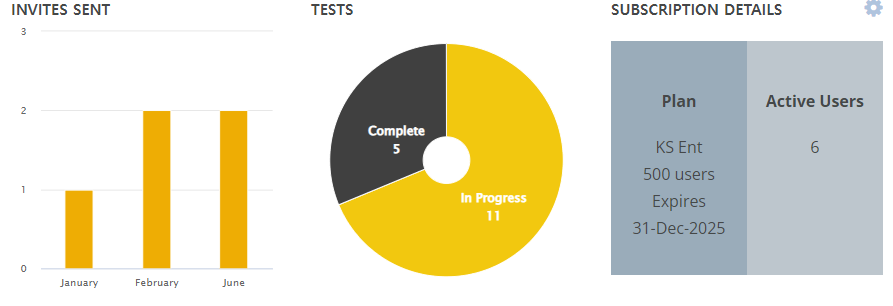
To make changes, click on the small gear wheel, top right. Here you may change the time period for capturing active user stats.
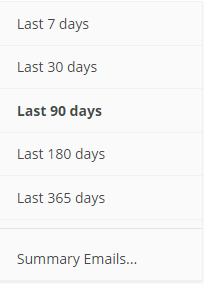
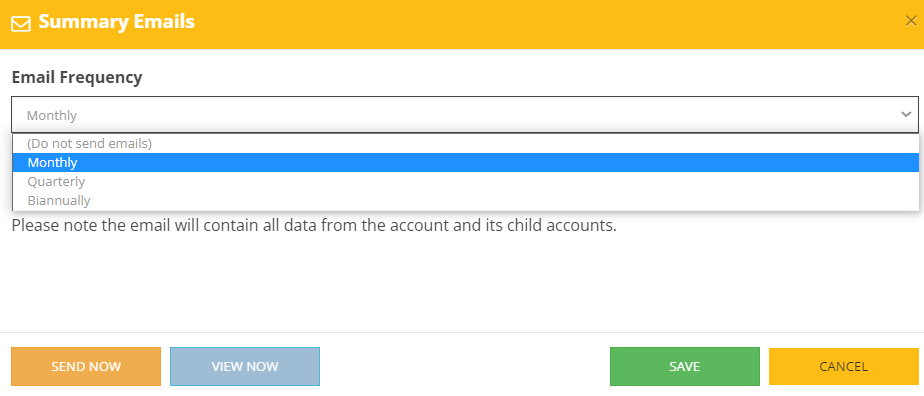
'Summary Emails' are available to send you a summary of account activity by month, quarter or biannually.
Data Analysis using the Query Builder
The Query Builder function provides a comprehensive tool for analyzing the data within your account, organizing it with the structure you want. There are several default queries and you have the option to create your own.
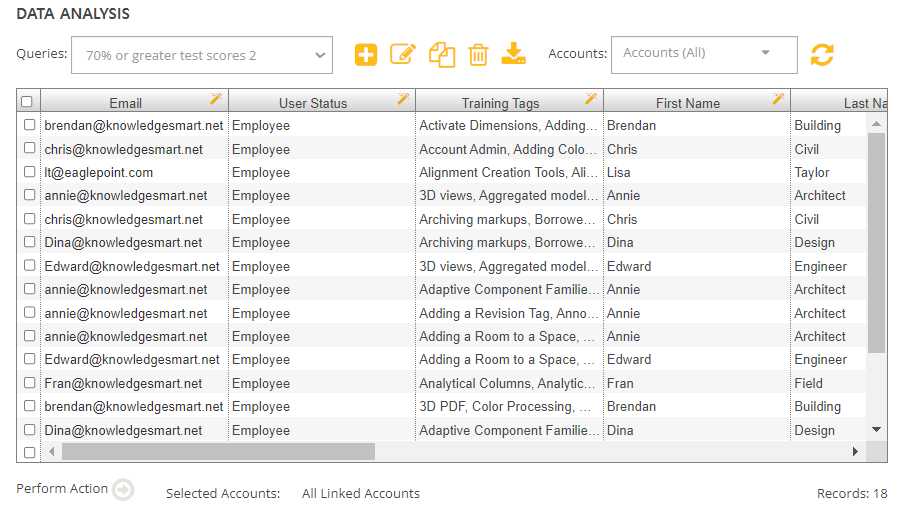
In the above screenshot the active query is shown in the box at top left. The columns and rows in the main window are responsive and change with the query selection.
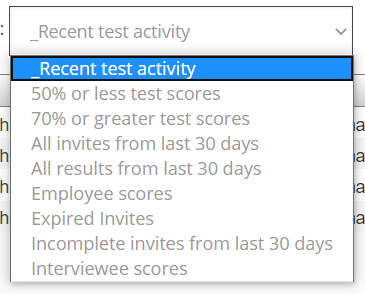
Use the dropdown to show the list of available queries. Queries are ordered alphabetically.
The first icon on the left creates a new query. The pencil icon allows editing of the active query. The third icon along is for copying the active query. The last icon downloads the query data to a .csv or MS Excel file.

Select which account the query applies to (if you have more than one). The default value is to include all accounts.

When creating a new query, you have the choice of all the data fields shown below.

Filters can be applied to the raw data to extract precise values and create sub-groups of your data.

When starting to use the Query Builder we recommend copying and editing some of the default queries. This will give you a good insight in how to construct a valid query.
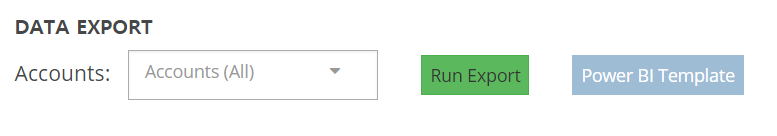
Power BI export
Here you can export the Power BI Excel file for your account by clicking on the green button. To access the Power BI template, click on the gray button.
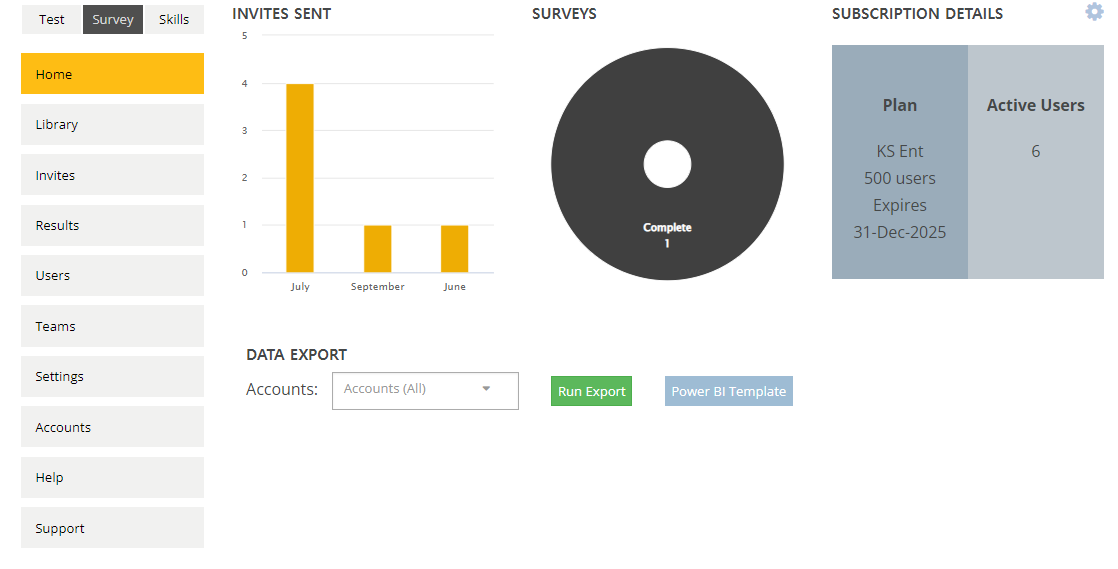
Surveys
The Survey area 'Home' page displays a summary of data for your general Survey activity.
Surveys have a separate master data export and Power BI template for data visualization.
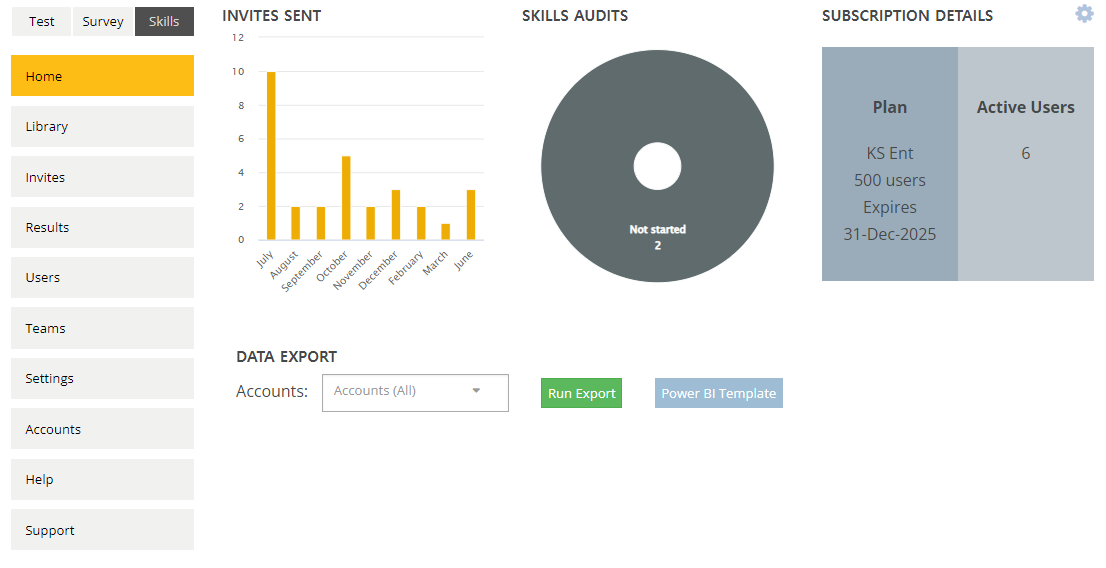
Skills
The Skills area 'Home' page displays a summary of data for your Skills audit activity.
Skills audits have a separate master data export and Power BI template for data visualization.
Still Need Help?